
 When to claim Social Security is a question with no easy answers.
There are simply too many variables, decisions, rules, etc. to sort through in making a great decision.
My feeling is that by sharing how some are considering the subject and digging into it, we all can learn what issues might impact our own Social Security decisions.
So when one of the Millionaire Money Mentors posted a detailed analysis on this topic, I just had to share it.
He agreed and that’s what I have for you today.
The analysis is done by Millionaire Interview 133 and is based on his specific financial situation, goals, plans, etc. — which means the analysis will not fit the exact situation for anyone reading this post.
But this is such a complete analysis that I know all of us will learn something, if not many things, which will help us in our own Social Security plans.
So with that said, I turn it over to Millionaire 133 for his detailed thoughts…
———————————-
I’ve been looking at the question of when to start collecting Social Security for my wife and me and have a generalized analysis of alternative strategies to share.
ESI has posted several articles that described approaches to determining when to start collecting your Social Security annuity here and here. These posts provide a great perspective on Social Security that I will not repeat.
The bottom line from my own analysis of Social Security strategies is that the choice of the best strategy depends upon a lot of factors and is more complicated than you might expect. But, for ESI followers with savings at retirement and the ability to earn a reasonable return on those savings, starting early looks very tempting.
While there are several free and paid tools that provide guidance on Social Security strategies, I found them all to be too simplified for my situation (the best of the tools that I found is free – Open Social Security). I also did not like the black box nature of the tools – I need to see the data to understand and trust the outcomes.
I modified my financial analysis tool to assess Social Security claiming strategies for a couple. I’ve gradually developed this tool over many years for my own use as a way to provide insights into the many factors that can impact a financial plan. I’m not a financial analyst or adviser or an expert on Social Security strategies – I am sharing my own perspective and plans for collecting Social Security.
Analysis Overview
I set up the analysis with a simplified scenario: a couple of the same age retiring when they turn 62 with a $1M portfolio and no other sources of income or assets at the start of retirement.
I looked at three portfolio rates of return after inflation: 0%, 2.5%, and 5 % – you should add 2-3 % to these rates of return to account for average rates of inflation.
I looked at three levels of retirement income draw from the portfolio including Social Security annuities: $75K, $80K, and $85K. The retirement income draw did not vary with age – if it was $75K at age 62 then it remained $75K in constant dollars until age 90.
I looked at Social Security benefits based upon on one retiree with an average of $60K in income over their best earning 35 years and their spouse with an average of $40K – these income levels only matter for establishing the amount of Social Security benefits. I ran a few excursions around these parameters and the excursions did not change the outcomes.
I assumed that Social Security benefits were adjusted each year for inflation with a COLA. I did not consider taxes.
Of the 72 or so possible combinations of ages to start collecting Social Security, I examined 17 combinations.
My assumptions were not completely random. I wanted a portfolio that was large enough to allow at least a 7.5% draw from age 62 until age 70. But not so large that it dominated retirement finances (if you have a large portfolio then it doesn’t really matter when you decide to start collecting your Social Security annuity). I’ve selected withdrawal rates that allow the portfolio to survive until at least age 90 in most cases.
General Findings and Support
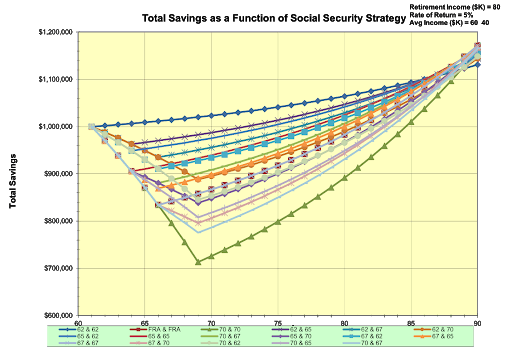
First a chart that we have all seen in some form that shows cumulative Social Security benefits as a function of age and the year that these benefits start. This specific chart accounts for both spouses collecting their Social Security annuities at the same start age, from 62 to 70. This chart assumes no earnings on the Social Security benefits – a key assumption.

The chart suggests that starting benefits at age 62 is the best strategy until age ~77 and delaying benefits until age 70 becomes the best strategy starting at age ~82. The chart doesn’t account for the potential for one or both spouses dying along the way – everyone lives to age 90 in this chart.
The crossover point is the age at which the lines converge – ~79 in the above chart. If we relied only upon this chart, then a logical decision would be to take Social Security benefits starting at age 70 because our life expectancy is greater than 84.
So what happens if there are savings in addition to Social Security benefits and those savings earn a return? The bottom line is that portfolio earnings increase the breakeven ages.
With a moderate risk assumption of a portfolio rate of return of 5 % after inflation, starting benefits at age 62 is the best strategy until age 87 and delaying benefits until age 70 becomes the best strategy after age 90.
Within the assumptions that I used in this analysis, variations in retirement income, in the amount received in annual Social Security benefits, and in portfolio size beyond $1M at age 62 do not impact this outcome (beyond causing the portfolio to deplete before the end of the analysis period at 0% rates of return after inflation).
Lower rates of return bring the crossover points back towards the analysis with no earnings on the portfolio. Earnings higher than 5% further increase the crossover points.
Do these results make sense? I think so.
Earnings on the portfolio reduce the rate of portfolio depletion, and in some cases the trend reverses and the portfolio actually grows over time – even with a 8% initial withdrawal rate (reduced by the amount of the Social Security annuity).
The next few charts show the trend for one case: $80K in retirement income including Social Security annuities with 0%, 2.5%, and 5% portfolio earnings rates after inflation. The textbox in the upper right summarizes the inputs behind the calculations for each chart.
With no earnings the portfolio depletes in ~25 years. With an annual rate of return of 2.5% after inflation, the portfolio survives. And with an annual 5% rate of return it grows a bit over 30 years.

0% rate of return after inflation, retirement income of $80K/yr.

2.5% rate of return after inflation, retirement income of $80K/yr.
5% rate of return after inflation, retirement income of $80K/yr.
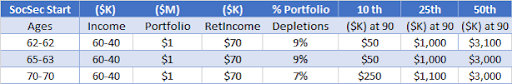
A table with the cases that I considered is below.
For both spouses collecting their Social Security annuities starting at age 62, it shows the crossover age at which both spouses start collecting at age 62 (62-62) is no longer the best strategy (the best strategy is defined as the one that results in the largest portfolio value). For the 70-70 column, it shows the crossover age at which both spouses collecting starting at age 70 becomes the best strategy. The 65-63 column shows the crossover age at which 70-70 outperforms 65-63.
All of the other age combinations more or less fall between these alternatives.
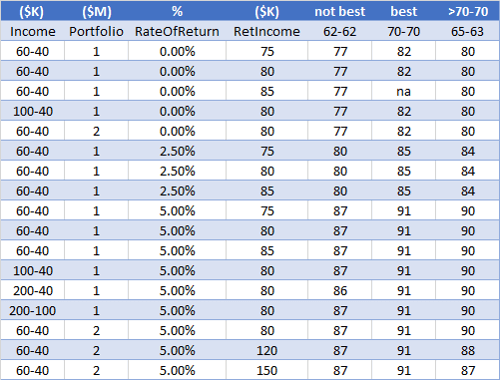
For the cases where the portfolio depletes prior to age 90, a different withdrawal rate would make sense. With a 7% initial withdrawal rate including Social Security annuities, the portfolio survives until age 90 in most cases.

0% rate of return after inflation, retirement income of $70K/yr.
A few comments on the trends from this analysis:
- Don’t draw specific conclusions about your Social Security strategy from these charts – this is a conceptual analysis that is intended to show trends. Your specific situation will be different for many reasons, including: the variations in the composition of your portfolio and its annual rate of return after inflation, the size of your portfolio relative to your withdrawal rate / retirement income level, other sources of income or expenses in retirement, your risk tolerance and longevity, your legacy planning goals, etc. etc. etc.
- Don’t discount the value of Social Security. Go back to the first chart and take a look at the vertical axis. Lifetime combined benefits for you and your spouse/partner are ~$1M (adjusted for inflation), equivalent to your starting portfolio. Without Social Security, this analysis would need a portfolio of ~$2M to support the same $80K/yr retirement income using a 4 % withdrawal rate.
- Since Social Security benefits are adjusted for inflation, they are a hedge against outliving your portfolio. If your family is long lived, then delaying the start of your Social Security annuity may make sense for you.
- The absolute level of the differences in some of the age combinations is relatively small – especially around the crossover points, which happen to align with life expectancies in several cases. Maybe it’s not worth worrying about exactly what age to start collecting Social Security – many other factors can sway the value of your portfolio over 30 years. Pick a start age for your social annuity that works for you and don’t look back.
For me, 1099/wage income after age 62 is an issue that impacts my plans. I can’t start collecting Social Security until I stop working or reduce my wage earnings to a minimal level. This problem helps to narrow my choices. I’m leaning towards starting my Social Security annuity at 65 with my wife starting hers at 63.
Sequence of Return Risk
The analysis above assumes the same portfolio rate of return each year from age 62 to age 90 as a simplifying assumption. But that is not how the market works. As an example, 5% average rate of return doesn’t look as good if the three-year sequence of returns is 0%, 0%, and 15% (for a 3-year average rate of return of 5%) because the annual withdrawals deplete the portfolio during those initial two years.
To assess sequence risk, I ran a Monte Carlo analysis of a few of the cases from Part 1. I assumed the same $1M portfolio, Social Security annuities based upon average incomes of $60K & $40K/yr, a withdrawal of $80K/yr starting at age 62 including any social security annuities, and constant dollars (all of the dollars are inflation adjusted). I used the historical average inflation adjusted rate of return (8.6 %) and standard deviation for the S&P500. I assumed a normal distribution of returns to calculate annual returns (a simplifying assumption).
The chart below shows a normal distribution of the annual S&P 500 rates of return with the annual rate of return on the horizontal axis and the frequency of those rates of return on the vertical axis.
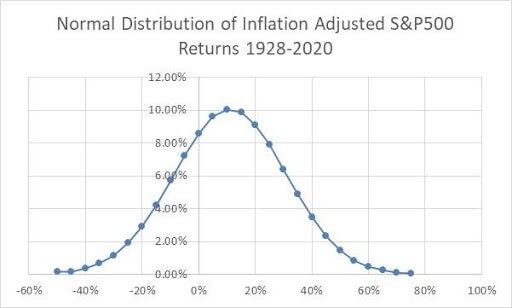
While an 8.6% average annual rate of return adjusted for inflation sounds fantastic (and it is), the chart above suggests the issue with sequence of return risk – the potential for large negative rates of return during the early years of retirement that deplete the portfolio to a point where it can’t recover and the retiree is left with only their Social Security annuity (no funds from their portfolio).
I ran 1000 iterations of each Monte Carlo analysis and did not consider the absolute worst (or best) outcomes. I report the median outcome, the bottom 25 % of outcomes, and the bottom 10 % of outcomes.
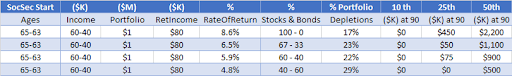
The table below summarizes the initial Monte Carlo analysis. I want to emphasize that this table only shows the outcome in terms of the portfolio – the Social Security annuity continues for life independent of what happens to the value of the portfolio.
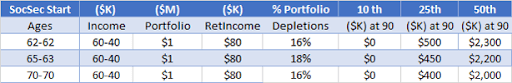
Let’s look at portfolio depletions. This column in the table shows the percentage of the 1000 runs that resulted in the portfolio being depleted prior to age 90 and is ~16 %.
The next three columns show the value of the portfolio at age 90 for the 10th percentile (bottom 10 % of cases), 25th percentile, and 50th percentile (median) cases. I did some rounding of the outcomes to reflect the approximate nature of a Monte Carlo analysis – the trends are where we should focus.
The first thing that I notice in this table is that even with a nice average after inflation rate of return of 8.6%, the bottom 10% of cases deplete the portfolio independent of the ages at which one starts to collect their Social Security annuity with an $80K/yr retirement income starting at age 62. But wait – didn’t the initial analysis suggest that a 5% inflation-adjusted average rate of return result in more money at age 90 than the initial portfolio value? I’ll explain what is happening in a moment.
I also see that in the median case, the portfolio ends up far larger in constant dollars at age 90 than the starting point of $1M. This outcome is not a big surprise with the 8.6% average annual rate of return after inflation.
The alternatives shown in the table above are all approximately equivalent, showing no meaningful differences in portfolio values based upon the age at which the Social Security annuities begin. Again, the large 8.6 % rate of return is influencing this set of outcomes.
Returning to the issue of portfolio depletion with a retirement income of $80K. I ran a few cases with a reduced retirement income of $70K/yr starting at age 62. This reduced level of income improved the portfolio depletion that we saw in the 10th percentile outcomes above.
Another approach to avoiding portfolio depletion is to adjust your retirement income if your portfolio suffers a bad year. This is a topic for another day as a reactive retirement income is currently beyond the capabilities of my existing tool. A larger portfolio and earned income in retirement also mitigate sequence of return risk.
A few comments on sequence of return risk:
- This analysis is limited to a few specific cases and intended to show the potential impact of different assumptions on a retirement plan. Your mileage will vary.
- These Monte Carlo analyses are very dependent on the historical performance of the S&P 500. If you believe that the future will look like the past, then these results are reasonable. If you believe that the near future is likely to be less rosy than the past, then an 8.6 % inflation adjusted rate of return is higher than what can likely be achieved in a moderate risk portfolio.
- Plans are not static. They need to be periodically adjusted. My personal approach to mitigating sequence of return risk is to be prepared to adjust my plan when things go either much worse or much better than average.
The Effect of Portfolio Volatility
I mentioned at the beginning of the post that selecting an optimal social security strategy is complicated. Portfolio volatility is another factor that is important to consider but is often left out of these discussions.
The Monte Carlo analysis above used historical market data for a S&P 500 portfolio that captured returns and volatility from 1928-2020. That work led me to ask myself about the degree to which the volatility or variations in annual returns influenced sequence of return risk.
To assess the risks associated with volatility in the annual portfolio rates of return, I analyzed portfolios that included both stocks and bonds and I created artificial portfolios to systematically assess the impact of volatility on portfolio performance. I also considered average annual rates of return other than 8.6%.
Conventional wisdom is to reduce portfolio risk as you approach retirement by adding bonds to your portfolio. Bonds have reduced but more certain rates of return than stocks (assuming that the bond is purchased outright and held to maturity). Reduced volatility results in a lower probability that you will suffer large swings in your annual rate of return that deplete your portfolio. Historically, 10-year Treasury bonds have provided a 2.2 % inflation adjusted return with much lower volatility than the S&P 500. Let’s look at the same $1M portfolio with various combinations of stocks and bonds.
The above table shows portfolios with mixed compositions of stocks and bonds. While bonds reduce the volatility of the portfolio, they also reduce the average rate of return and hence lead to worse portfolio performance. Bonds offer advantages that are not reflected in this analysis – including fixed rates of return for bonds that are held to maturity.
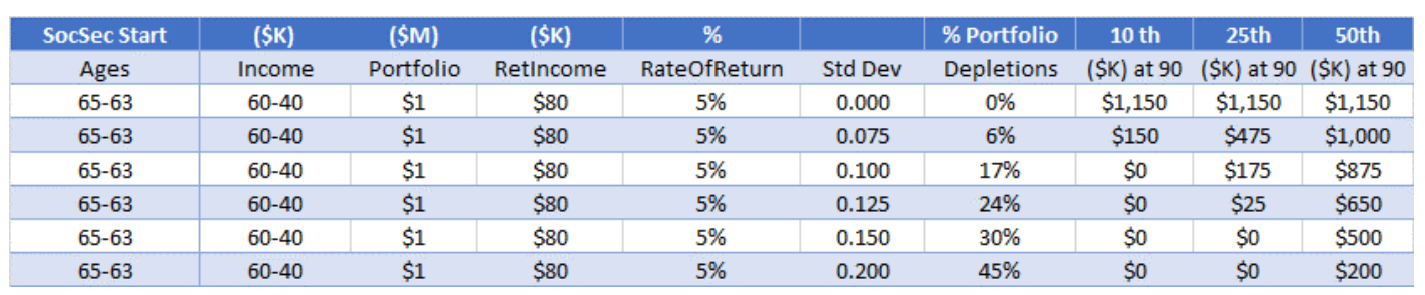
Next, I created artificial portfolios that varied the rate of return and volatility without specifying a mix of assets – the portfolio doesn’t care how the rate of return and volatility are achieved. I used the standard deviation of the annual rate of return as a measure of volatility. First, let’s go back to the base case of a portfolio with a 5% annual rate of return and no volatility to match the analysis in the early section of this post:
![]()
With no volatility, there is no difference between the best and worst case within the Monte Carlo analysis as the distribution of outcomes is a vertical line with 100 % of the cases at the specified rate of return of 5 %. Over ~30 years, the portfolio grows slightly from the original $1M while producing $80K/yr in retirement income. When someone quotes an average rate of return for a portfolio, they are typically talking about a rate of return with no volatility.
Next, I varied volatility with a constant 5% annual rate of return. The .200 case is close to the volatility of the S&P500 from 1928-2020 and the .125 case is close to the midpoint between the volatility of the S&P 500 and the 10-year Treasury bond. As expected, increasing levels of portfolio volatility result in greater probabilities of swings that result in portfolio depletion (or growth – the 90th percentile portfolio values can be astounding).
In general, I want stock portfolio rates of return and bond portfolio levels of volatility. A low volatility portfolio can be constructed with a mix of dividend stocks, short-term bonds, real estate, and annuities.
I hope that the brief discussion of the impact of volatility on portfolio longevity has pointed out one of the challenges of a simplified analysis of a Social Security strategy. The specific elements of a portfolio matter and need to be considered when formulating a Social Security strategy.
Where does the addition of a sequence of return and volatility analysis lead me as I consider my own Social Security strategy? To the same conclusion – start as early as practical (65 and 63 is our plan) and maximize our annual withdrawals ($80K/yr in this analysis).
Our portfolio is balanced and lower volatility than the overall market. I am confident that we can use the techniques briefly mentioned above to adjust our situation as needed if we are really unlucky during our initial years of retirement.
First and foremost, Thank You for your perspective on this subject. After reading, re-reading and then looking at my own reasons for drawing at age 65 yrs, I can only state that the reasons for anyone, to draw early, or wait until age 70, relies primarily on the individual financial situation at the time of eligibility for SS entitlement. For those who have pensions, lifetime medical, and no debt upon retirement, with a modicum of savings, and who live within their means, can reasonably benefit from drawing later than sooner. In my case, drawing sooner was gravy in the pot, as all recieved benefits were saved on a monthly basis and now after twentysomething years has grown substantially. I also subscribe with the saying, a little now, is still better than none at all. Thanks for all your counsel in this article.
The market has had a good run over the 20 years of your retirement. As the analysis suggests, it is not uncommon for the top 50 % of outcomes to result in a larger portfolio at the end of 30 years than the starting point.
“For those who have pensions, lifetime medical, and no debt upon retirement, with a modicum of savings, and who live within their means, can reasonably benefit from drawing later than sooner.”
My wife and I fall into this category. I am retired and she plans to work another 5 years which would take me to 69 so no reason for me not to wait until 70 to take my SS. We also need to plan for taxes and taking the extra income now, while we don’t need it, would probably not be in our best interests. My wife hits her FRA of 67 about 5 months after I turn 70 so what we will consider doing is taking mine at 70 and maybe start hers at 67 but we will still look at the tax ramifications when the time comes.
I am very curious regarding the tax implications. Our planning thus far is to start taking $ out of our (ira and 401k equivalent – we are Canadian taxed investments,) hold off on social security till 70. I want to do a tax analysis, do you have any tools to assist with this? If we leave too much in our ira/401k at the later years we will be heavily taxed as we have mandatory withdrawals starting at 71.
Thanks
Incredible analysis. Thank you for sharing.
The more I think about it the more I lean towards drawing it earlier. My portfolio by the time the decision needs to be made will likely be quite large. The age to breakeven with early vs delayed SS is a lot higher than I anticipated it and who knows how many years I would be around after to take advantage of it
We are fortunate to have choices!
Thank you very much for your detailed analysis!
I would agree that the age and timing of drawing social security benefits largely depend on the individual’s financial situation. In part, I believe that whether drawing earlier or later depends on your family’s longevity and health history. I’m thinking back to the days of File and Suspend, where it would have (in certain situations) made sense for the spouse to accrue the 8% benefits until age 70, while their partner takes their spousal benefit and also accrues their benefits to optimize their SS income. Sadly, of course, this no longer is a tactic that we can employ today.
Although I am particularly interested in the subject of social security, I am afraid I am not relying on social security benefits once it’s my turn to file (which is another good 40+ years away). Perhaps, if I am lucky, I may be eligible for residual SS benefits, but at this point, I’m counting on my own investments to hold me over in my Golden Years.
I’d be interested to know your thoughts on social security planning for millennials – would you agree that at this point it might not make sense for millennials to count on social security income during retirement? Or, would you assume that the SSA would provide SS benefits, on a means-tested basis and at a later FRA age? (Then again, arguably most millennials are probably not thinking about social security at this point…).
Thanks again for your analysis.
Cheers,
Fiona
Keep paying your FICA taxes to support us old folks!
I personally anticipate additional means testing for social security benefits, including taxation of 100 % of the annuity (vs up to 85 % today) and possibly losing or reducing the annual COLA for high income retirees. Also likely in my view is an increase or elimination on the cap in wages that are subject to social security taxes.
We may also see an increase in the full retirement age. Although there would be a lot of pushback and hence I see this outcome as less likely than other alternatives. The most common age to start collecting social security benefits is 62.
I am very skeptical about the potential for eliminating benefits for higher income retirees as that approach would harm the wealthy portion of the population that subsidizes our pay to play political system.
Assume SS won’t be much when you take it. Maybe $1,000 a month. Save your own money, it will grow faster and bigger when you start early. SS is capped at 8% a year if you defer, but no growth factor before aged 62. Even an extra $250 a month will be more of a benefit than SS.
Maximizing the benefit is the consensus opinion method of analyzing this problem but it had no bearing at all in my decision. In my case I paid the maximum amount possible into Social Security every single year of my 35 working income history. Even my first year of employment I made slightly more than the maximum amount that Social Security taxed. My wife only paid into the system for nine years after which we became a one income family. Consequently I will receive the maximum amount Social Security will pay anyone while she is only eligible for a small amount. My decision to defer receiving my benefit until age 70 is to leave her with my larger benefit after I die. I’m not planning on going anywhere soon but since she is still running full marathons at age 66 and I ran my last one at age 62 I think it is safe to assume she’ll outlive me. She won’t need the money but I think getting a large benefit every month will provide some additional peace of mind for her. She did elect to receive her benefit at her full retirement age of 66 and three months, because that was essentially free money and doesn’t impact what she’ll get when she switches to spousal benefits when I turn 70 and survivor benefits later on. I have to thank my Vanguard advisor for suggesting this path, I originally thought we both had to wait until 70 to get that maximum survivor benefit.
Thanks for pointing out the additional complexity of if / when to take spousal benefits. To keep the post from getting too long, I glossed over this point.
Agree, Steveark. Crossover is important, but peace of mind for my surviving spouse is also. She’ll file early (small numbers), I’ll go later. Maximum annuity for old age, with COLA (that my Pension doesn’t have).
Thanks MI133.
One additional point regarding spousal benefits. In a situation like mine, where I have paid in the max for 30 years and wife has paid in very little, there is a provision to allow her to increase her benefit to 50% of mine. With that added incentive, I plan to wait until (or close to) my full S.S. retirement age in order to optimize BOTH of our S.S. checks.
This is a GREAT – and very thought-provoking – post. The answers to many questions like this often boil down to “do the math” and it’s great to see someone actually do it. Of course, everyone’s personal math is unique, but even ‘one set of circumstances’ illustrative math like this is quite useful.
Nevertheless, the big takeaway for me was how larger investment returns (from invested Social Security benefits) push out the “crossover” age. And, that makes intuitive sense – earlier retirement benefits should be more valuable than later ones, IF one can invest them and get returns above inflation/benefits assumed by the Social Security retirement age tables.
This gives me considerable food for thought. My mindset was always been – particularly because at least my father’s family is typically long-lived (my dad turns 88 this year seems to have the health of someone 10-15 years younger) – to simply delay taking Social Security for as long as possible/until age 70. BUT, since my wife and I should have a net worth >$5M when we retire (and likely ~$4M of that available to generate investment/retirement income), MAYBE we should take our benefits sooner and just invest them?
We’ll see – I’ll keep doing my own math. Regardless, well done to MI-133 for framing the issue so well.
I like your “do the math” approach. “Math” may include actual calculations or a subjective assessment of comfort level.
Nice, thorough analysis!
After building out my own retirement model for the last several years I finally decided to start over again, based on what I had learned, and greatly simplified things into a new model that incorporates SSA for each of us, based on our actual ages (eight-year difference), various starting dates, various mortality ages, various inflation rates, and various portfolio rates of return.
The thing to keep in mind, I’ve learned (and continue to have to relearn) is that all the modeling in the world will not predict the future. And regarding SSA claiming, it all ultimately really comes down to a very single decision: when do we each start claiming. That’s it.
Given those two truths (at least truths for me), I came to my model results as weather vanes to show me directionally the effect on our approach’s success, depending on whether we claimed earlier or later, died earlier or later, or had better or worse market returns.
Armed with that understanding, it then comes down to how much additional risk of guessing wrong on a variable am I willing to take in order to max out the upside in the portfolio at the end? Sure, we could both wait until we’re 70 to claim; and we could expect to both live to 95; and we could end up having a great bull run for 30 years. And that will for sure max out the end result. But what if we decide to go for the max SSA return at age 70, and one or both of us dies at 75 instead of 95? Would it have been better to claim at 62, even though we leave 9% of SSA potential benefit on the table if we both end up living to 95?
And how will we feel when we’re retired, drawing down from our portfolio at 62, waiting for 8 years before we turn on the tap for SSA funds to come in and reduce the rate of draining? Is that worth the extra 9% (or whatever it ends up being in the end)?
I had a boss who said that the best plan is the one that you write down at the end of a project.
The uncertainties that you mention along with the directional guidelines from the Monte Carlo analysis trends are what led me to the 65-63 decision for my wife and me. If I did not have continuing earned income until age 65 then I would start collecting social security earlier.
Great information, I started taking SS at 63 and am now thinking about putting in a request for withdraw. I would be doing this within the first 12 months. The reason is that I do not need the money at this time and have been investing the money into tax free bond funds.
Has anyone ever withdrawn their SS? Is it problematic to receive your SS the second time?
Excellent analysis.
Based on my recent SS statement, I did a simple math of what percentage more I would receive by waiting to collect at each age.
63 vs 63 – 6.83%
64 vs 63 – 7.00%
65 vs 64 – 8.57%
66 vs 65 – 7.93%
67 vs 66 – 7.30%
The way I look at it, that seems like a great return for a safe investment. So by waiting to collect, I would be kind of diversifying my risk. So, I will probably take it at 66 or 67 as the return seems to be declining after 65. Again, I’m 55, so I would need to reassess in 7 years when I become eligible. I’m not planning to wait till 70.
Hey M133, thanks for this great analysis. I enjoyed it over on the Mentors forum and it spurred me to think hard about timing of my wife’s SS start. Here are the details I considered:
She worked enough early in her career to have her own SS higher than 50% of mine.
Mine will max out SS annual payments, when ever I take it.
She has not had a W2 in about 25 years.
She is a little, ahemmm, older than me.
I am 60 and still working, will likely keep doing so for a few more years (maybe 5?), as long as I am enjoying it and being well paid for fun stuff.
She hits FRA in about 6 months.
SS will be a part of our retirement spending needs, but likely a small part, considering portfolios and a pension that I started drawing this year (that would not go up if I waited.)
We both come from families of “long livers” (but small bladders…) 🙂
So here is my thinking:
We will start pulling her SS checks when she hits FRA before the end of the year. These will be taxed abusively because of my W2 earnings, but such is life.
We are already maxing out 401k, Mega Roth401k contributions, and putting a few points into the company stock program that buys stock at a 10% discount to the market, based upon quarterly periods.
We will take the “after tax” portion of her SS checks and use that in the household budget. We will then bump my employee stock purchases up to the maximum 15% of salary to take advantage of the 10% discount to market.
We should be able to operate under this scenario for however many years I keep working and build up a nice chunk of company stock. I may sell some quarters worth to arbitrage the purchases and take out the 10% discount, if we feel the need for either:
a. cash to spend or
b. diversification.
Company is pretty strong and getting stronger, so risk for the company stock is in line with S&P500 risk, maybe just a little less, since we make up a decent portion of the S&P500 index from a capital allocation viewpoint and trade at a slight discount to the average of the S&P.
We should probably have started taking her check already, with the above thought process, but couldn’t quite pull the trigger, because of tax thinking. Oh well, better late than real late…